
Fintelligent
A financial intelligence interface exploring research, analytical workflows, and clearer presentation of complex information.
https://finsighta.vercel.app ↗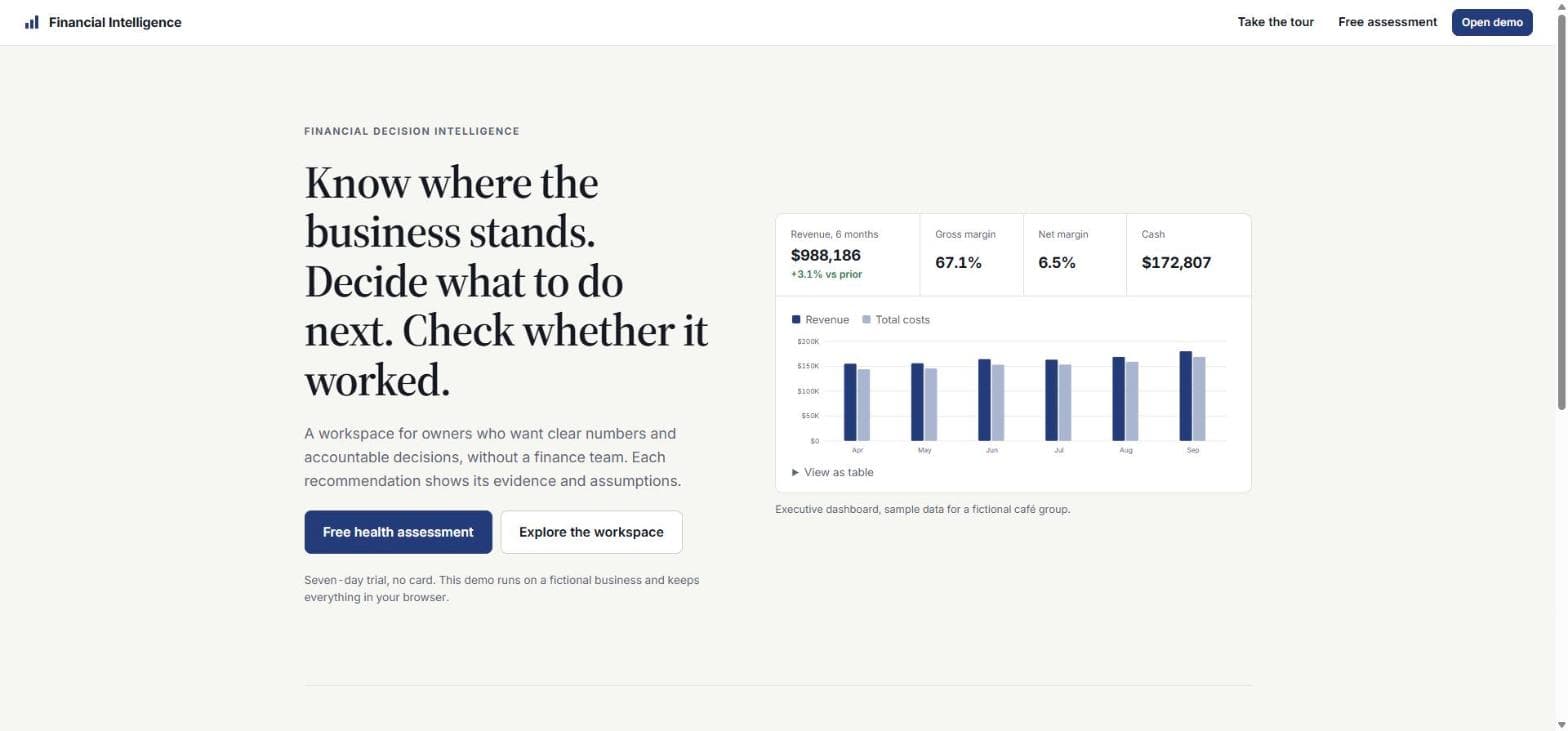
Fintelligent is a financial-decision-intelligence prototype whose homepage states its own scope plainly: an executive dashboard — revenue, gross margin, net margin, cash, and a six-month revenue-versus-cost chart — built against sample data for a fictional café group.
Financial dashboards usually ask the viewer to trust a chart without seeing its basis. The goal here was an interface that pairs each headline number with a chart the viewer can expand into a table, so a claim and its evidence sit next to each other.
A compact executive-dashboard card sits beside the hero copy on the homepage, with a "View as table" expand action under the chart. "Free health assessment" and "Explore the workspace" CTAs split lead-generation from self-serve exploration, and the demo explicitly discloses that it runs on fictional business data and keeps everything client-side.
- Executive dashboard card (revenue, gross margin, net margin, cash) with a six-month trend chart
- "View as table" expand action pairing every chart with its underlying numbers
- Explicit on-page disclosure that the demo uses fictional café-group data and runs in-browser
- Separate "Free health assessment" and self-serve "Explore the workspace" entry points
- Web Application
- Financial Prototype
Fintelligent is a concept/prototype financial workspace. Figures shown are sample data for a fictional café group, stated on the live site itself — no real assets, live financial feeds, certified advice or production transactions are involved. The project's source repository has not been confirmed by the owner.